Case study · Marketing agency website
An agency websitethat shows the moneybefore the pitch
Halftone is a website I designed and built as a demo for a performance marketing agency in Bengaluru. This is the full walkthrough: what each section does, how a business owner uses it, and the psychology that turns someone burned by an agency before into a booked call.
In one minute
- The site is built for a business owner who has been burned by an agency before, and answers their five questions in order.
- The first screen shows money out and money in for a sample client, not a slogan.
- A budget planner gives low, likely and high results, and a free audit shows where their site is leaking money.
- Clients see the one-page Monday report before they sign, and every case study says what didn’t work.
- Pricing is public, month to month, and the client keeps the ad accounts and data.
Who this is for
Marketing and advertising agencies, freelance media buyers, and any service business selling to owners who have been let down before.
Every idea here works on an existing site too. There’s a checklist at the end.
Jump to the checklistOn this page
- Start with the client who has been burned
- A first screen that shows money, not a slogan
- A budget planner that gives a range, not a promise
- A free audit that shows the leaks
- Show the report before they sign
- Results with the mistakes left in
- The ads that ran, and the ones that were killed
- The first 90 days, with both sides of the deal
- Name the people, and their hours
- Public prices, and an easy way out
- A short call, booked in a few taps
- It works on a phone
- The psychology at a glance
- Steal this for your own agency website
- Questions people ask
A business owner looking for a marketing agency has usually hired one before. They remember the monthly fee, the PDF full of impressions, and never knowing whether any customers came from the ads. They are not looking for the most creative agency any more. They are looking for one they can check.
Most agency websites are built for the opposite visitor. A showreel, client logos, a list of services and “let’s grow together”. To someone who has been burned, that reads like the last agency’s pitch.
With Halftone I set one rule: every claim must come with a number, a tool or a document the owner can check. Below is each section in the order you meet it, with the screenshot, what it does and the psychology behind it.
Halftone is a design demo. The agency, clients, results, team, prices and quotes are fictional placeholders, and for a real client they are replaced with the real ones before launch. The audit results are simulated. The design decisions and the psychology are what this post is about.
Step 01
Start with the client who has been burned
Almost every business owner who looks for a marketing agency has worked with one before, and many of them felt cheated. They paid a monthly fee, got a PDF full of “impressions” and “reach”, and never found out whether a single customer came from the ads. They are not looking for the most creative agency. They are looking for one they can check.
So I wrote down what that owner wants to know. It came down to five questions, and Halftone answers them in this order, with the question printed above each section:
- Will my money come back?
- How will I know what’s working?
- Have you done this for a business like mine?
- Who will actually work on my account?
- What does it cost, and can I leave?
Most agency websites answer none of them. They show a showreel, a list of services, client logos and “let’s grow together”. That is exactly the kind of marketing these owners have learned to ignore.
For the agency: the owners who were going to ask “but how will I know it’s working?” on the first call already have the answer, so the call starts at “when can you start?”.
Step 02
A first screen that shows money, not a slogan
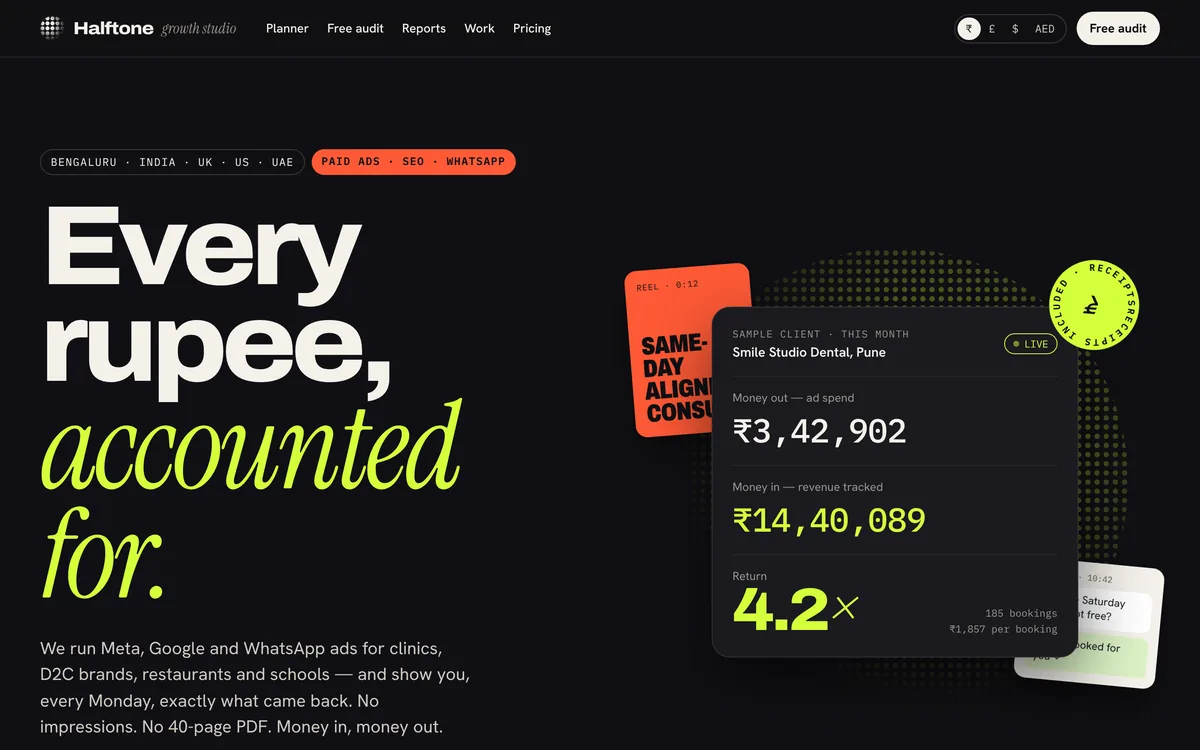
The headline is the promise in four words: “Every rupee, accounted for.” The word accounted for is in bright lime, the colour the whole site uses only for money coming back.
Next to it is a live card for a sample client, Smile Studio Dental in Pune. It shows money out (ad spend this month), money in (revenue tracked) and the return, 4.2×, with the bookings and the cost per booking underneath. The numbers tick up slowly as you watch. Behind it sit a reel cover and a WhatsApp chat, the ads that produced those numbers.
Under the hero, a lime ticker runs short results: Dental clinic, Pune · cost per booking ₹410 → ₹185. The buttons are Get a free audit and See the numbers.
For the agency: the site makes the promise every agency makes, then proves it on the same screen.
Step 03
A budget planner that gives a range, not a promise
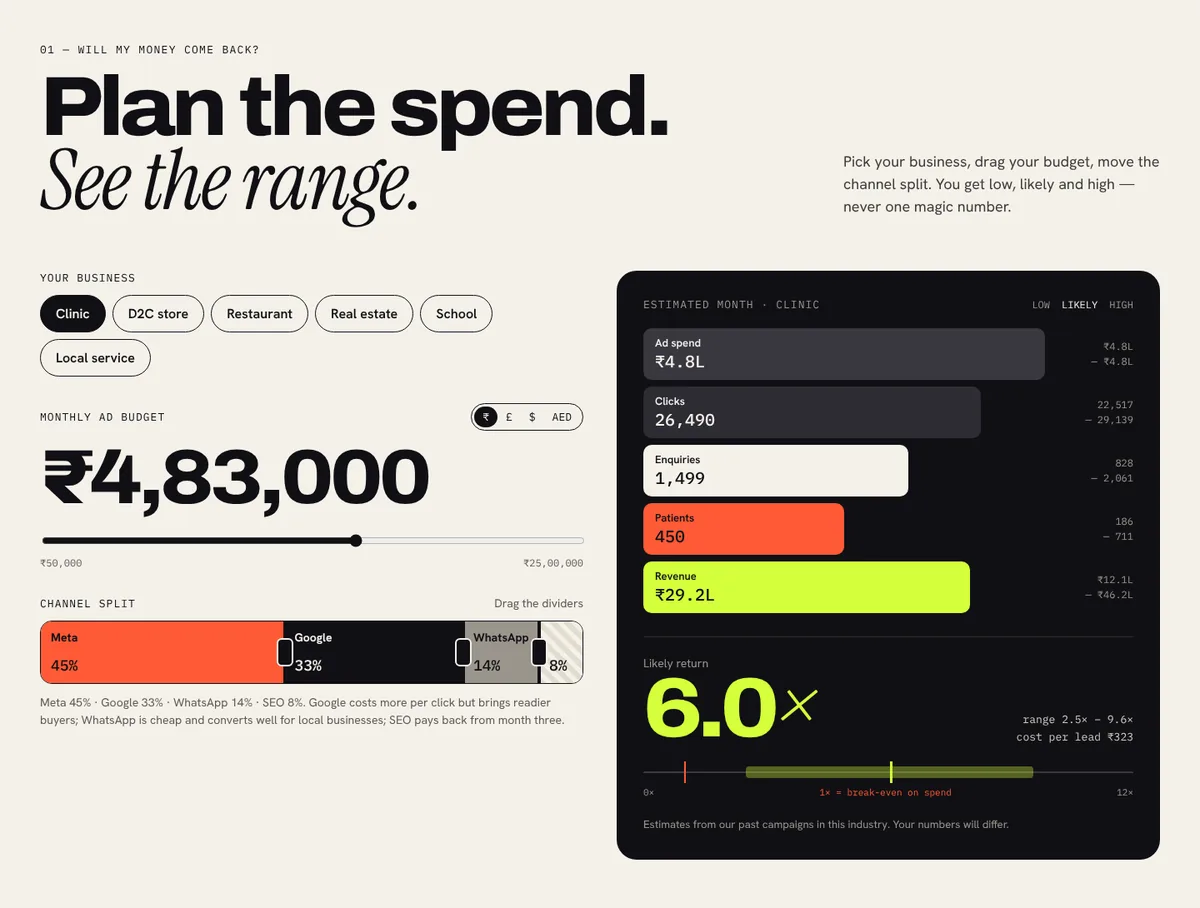
Section one answers “Will my money come back?” with a tool. The visitor picks their business (clinic, D2C store, restaurant, real estate, school or local service), drags their monthly budget, and drags the dividers to split it between Meta, Google, WhatsApp and SEO.
The result is a funnel from ad spend to clicks, enquiries, customers and revenue, each with a low and high figure beside the likely one, and a return of, say, 6.0× with a range of 2.5× to 9.6×. A line marks 1×, the break-even point. A note underneath says the estimates come from past campaigns in that industry and theirs will differ. The currency can switch between rupees, pounds, dollars and dirhams.
For the agency: prospects arrive with a realistic budget and a realistic expectation, which is the start of a client who stays.
Step 04
A free audit that shows the leaks
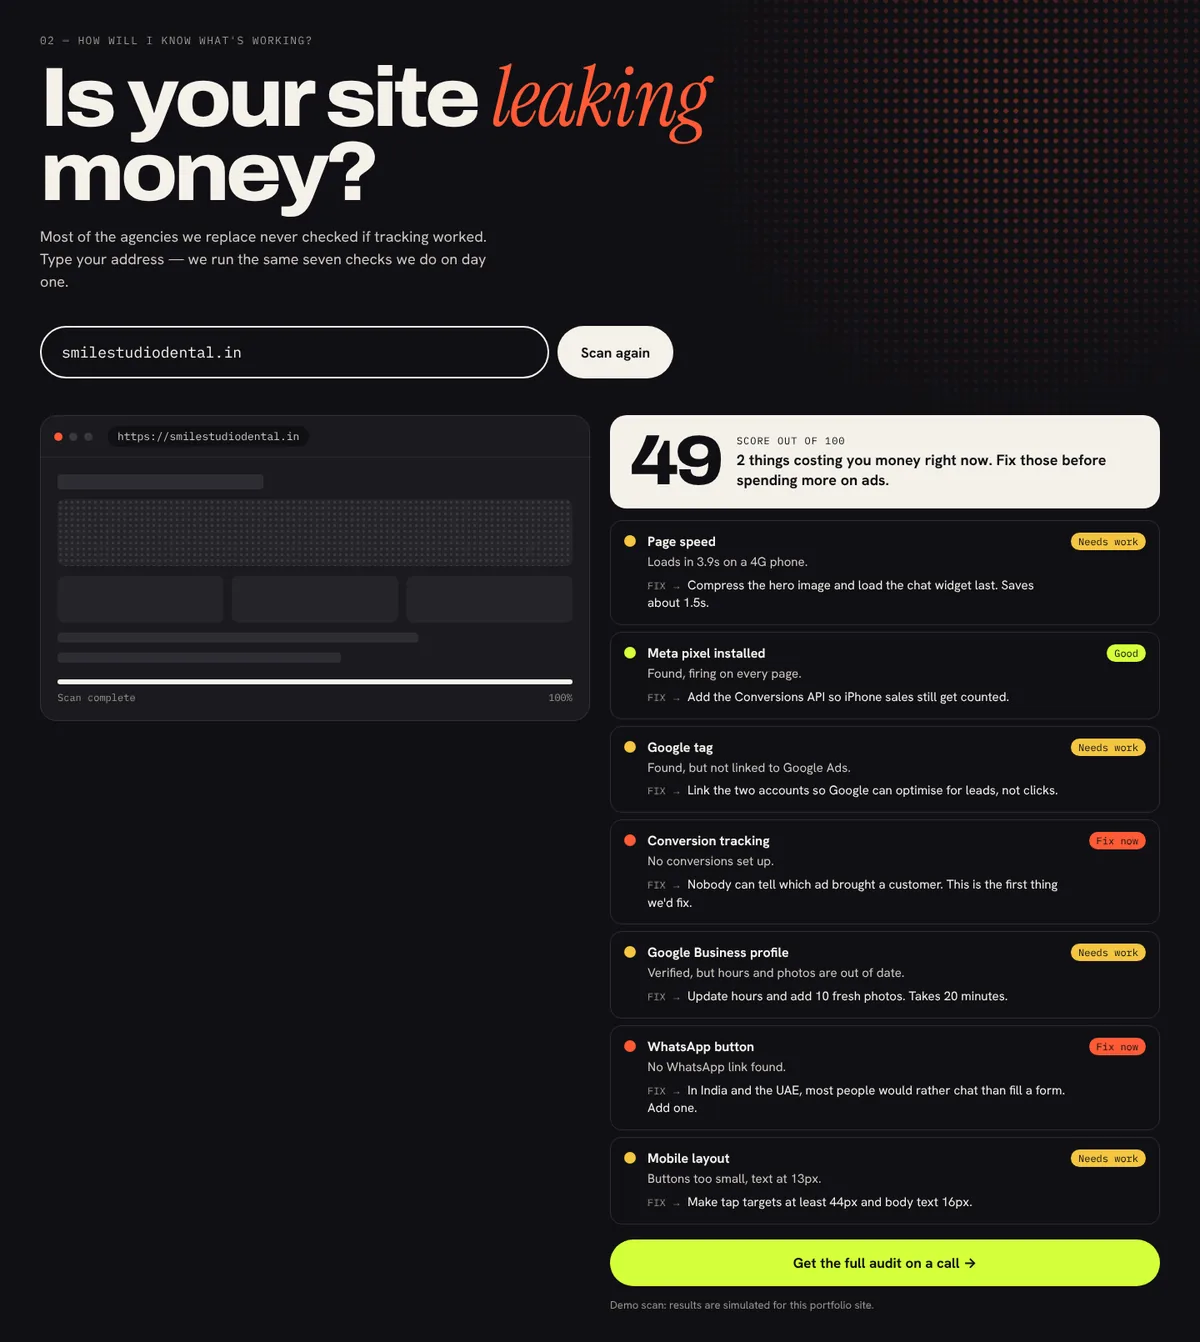
Section two answers “How will I know what’s working?” by asking a sharper question: “Is your site leaking money?” The visitor types their website address and a scan runs for a few seconds through seven checks: page speed, the Meta pixel, the Google tag, conversion tracking, the Google Business profile, a WhatsApp button and the mobile layout.
The result is a score out of 100 and a card for each check, marked Good, Needs work or Fix now, with a one-line fix: “No conversions set up. Nobody can tell which ad brought a customer. This is the first thing we’d fix.” A lime button offers the full audit on a call. In the demo the results are simulated, and the page says so.
For the agency: the audit is the agency’s best salesperson: it starts a conversation about the prospect’s own problems, with the agency already looking like the expert.
Step 05
Show the report before they sign
The next section is titled “One page. Not forty.” It shows the exact report a client gets at 9 am every Monday, by email and WhatsApp: spend, leads, cost per lead, revenue tracked and return; an eight-week chart; the best ad of the week and the worst ad, paused, each with its cost per lead; and three lines on what we’re changing this week, in plain words.
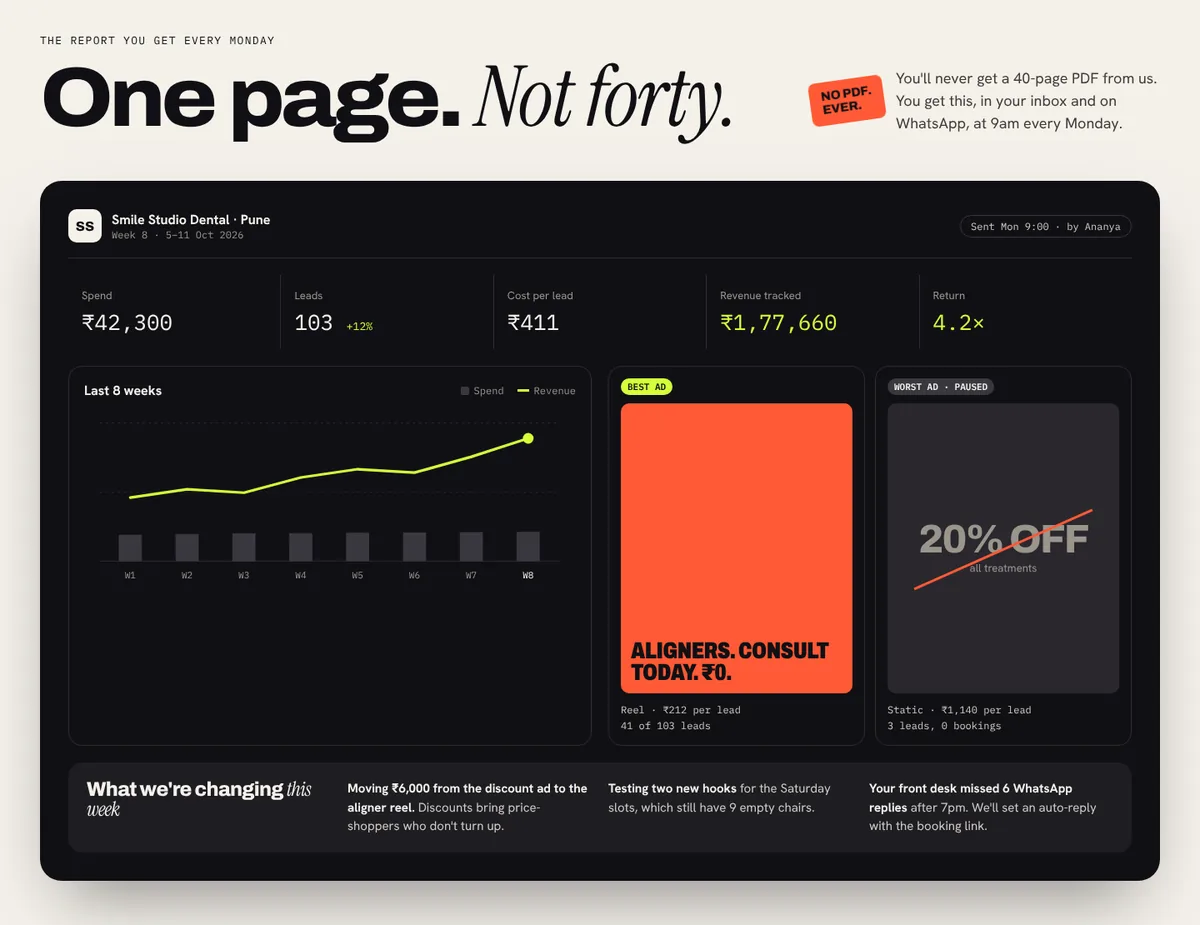
For the agency: the report becomes part of the sale, and clients who know what they’ll get each Monday ask fewer anxious questions in between.
Step 06
Results with the mistakes left in
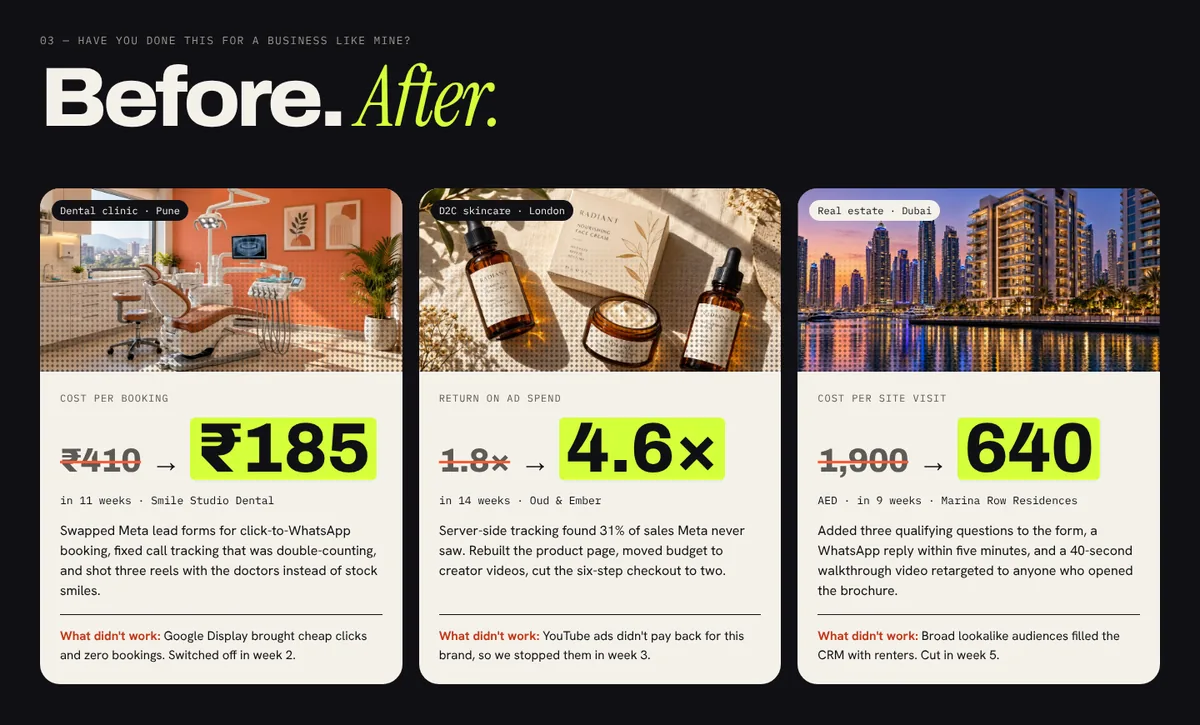
Section three, “Have you done this for a business like mine?”, is titled “Before. After.” Three case cards put the number first: a dental clinic in Pune whose cost per booking fell from ₹410 to ₹185 in 11 weeks, a skincare brand in London whose return went from 1.8× to 4.6×, and a property project in Dubai whose cost per site visit fell from AED 1,900 to 640. Each says what changed, and each ends with “What didn’t work”: Google Display brought cheap clicks and zero bookings, YouTube ads didn’t pay back, lookalike audiences filled the CRM with renters.
Below them, “In their words. Not ours.” gives each client a short quote, with how long they have been a client.
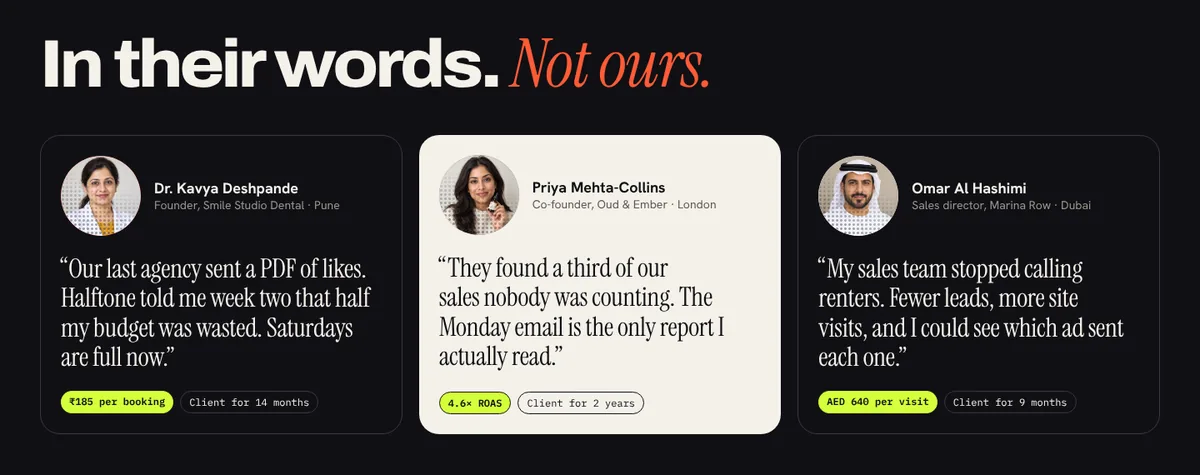
For the agency: prospects believe the results, and they see that the agency stops spending on what doesn’t work, which is what they were afraid of.
Step 07
The ads that ran, and the ones that were killed
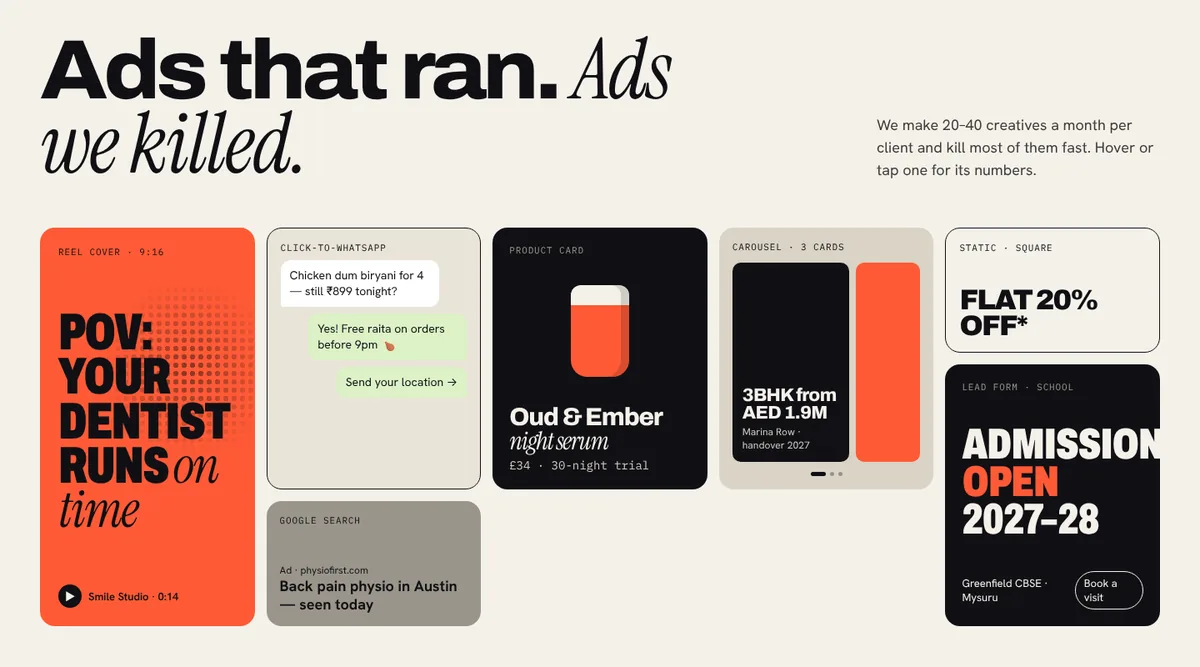
“Ads that ran. Ads we killed.” is a wall of real-looking ads, all drawn in code: a reel cover, a click-to-WhatsApp chat, a product card, a carousel, a Google search ad, a static offer and a school admissions ad. Hover or tap any one and it shows its numbers, and some are labelled as killed within days.
Step 08
The first 90 days, with both sides of the deal
A four-step timeline shows what happens after signing: week 1, fix the tracking; weeks 2–4, test a lot; month 2, cut the losers; month 3, scale what pays. Each step has two lines: You get (pixel and call tracking working, 15–25 new ads, a falling cost per lead) and We need (admin access, a half-day shoot, a reply on WhatsApp within a day, which leads became customers).
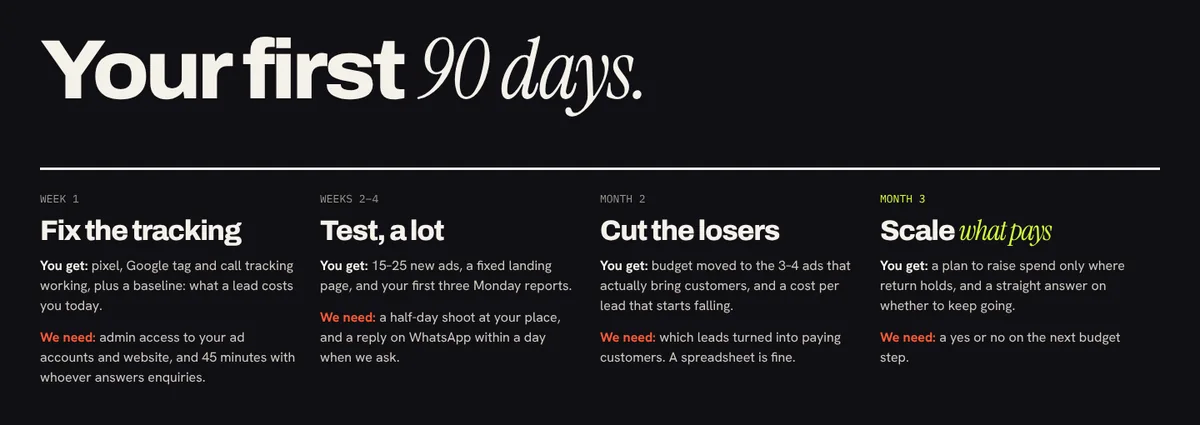
For the agency: fewer clients quit in month two, which is when most agency relationships end, because they knew month two was for cutting losers.
Step 09
Name the people, and their hours
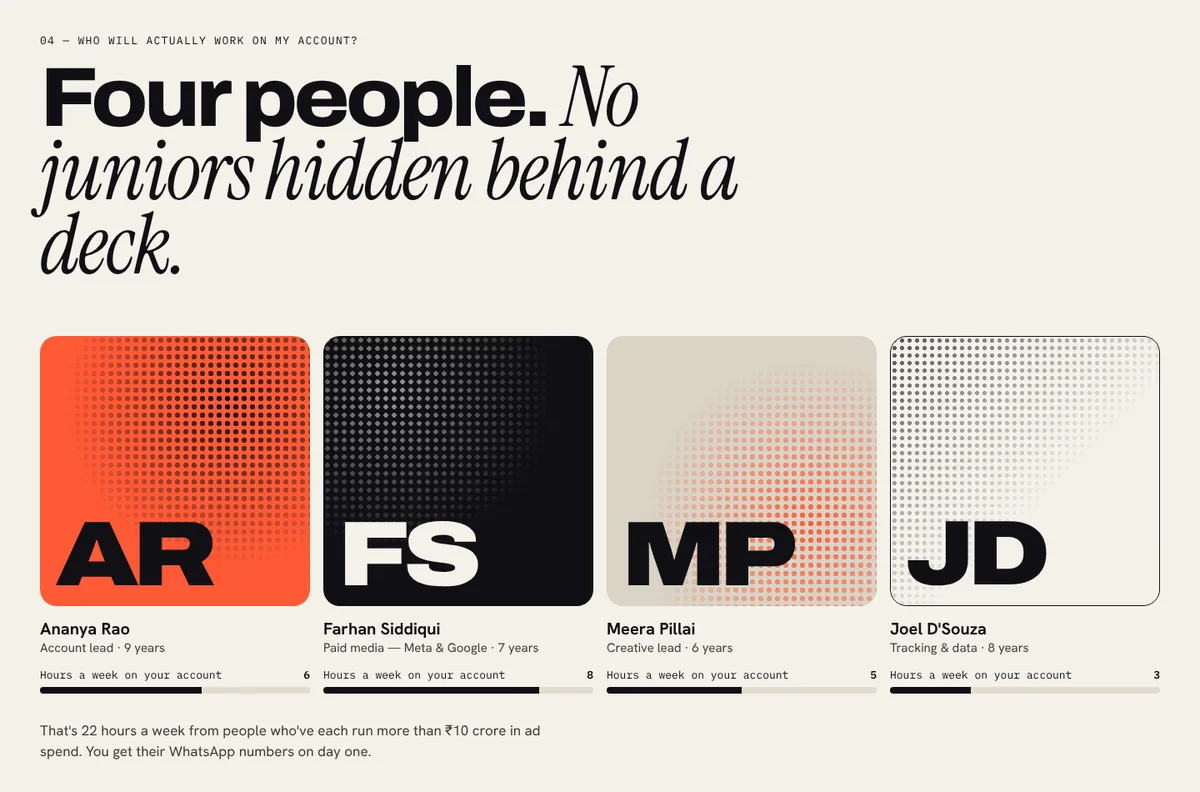
Section four, “Who will actually work on my account?”, answers with “Four people. No juniors hidden behind a deck.” Each person has a halftone portrait tile, their role and years of experience, and a bar for hours a week on your account: 6, 8, 5 and 3. A line underneath adds it up: 22 hours a week, and you get their WhatsApp numbers on day one.
Step 10
Public prices, and an easy way out
Section five, “What does it cost, and can I leave?”, answers both parts in the headline: “Month to month. Leave any time.” Three plans show the monthly fee, the ad spend each one suits and what is included, in the currency the visitor picked. A strip underneath says ad spend is paid straight to Meta and Google, and the client keeps the ad accounts and all the data. The FAQ starts with the hardest question: “Do you guarantee results?” The answer is no, and why.
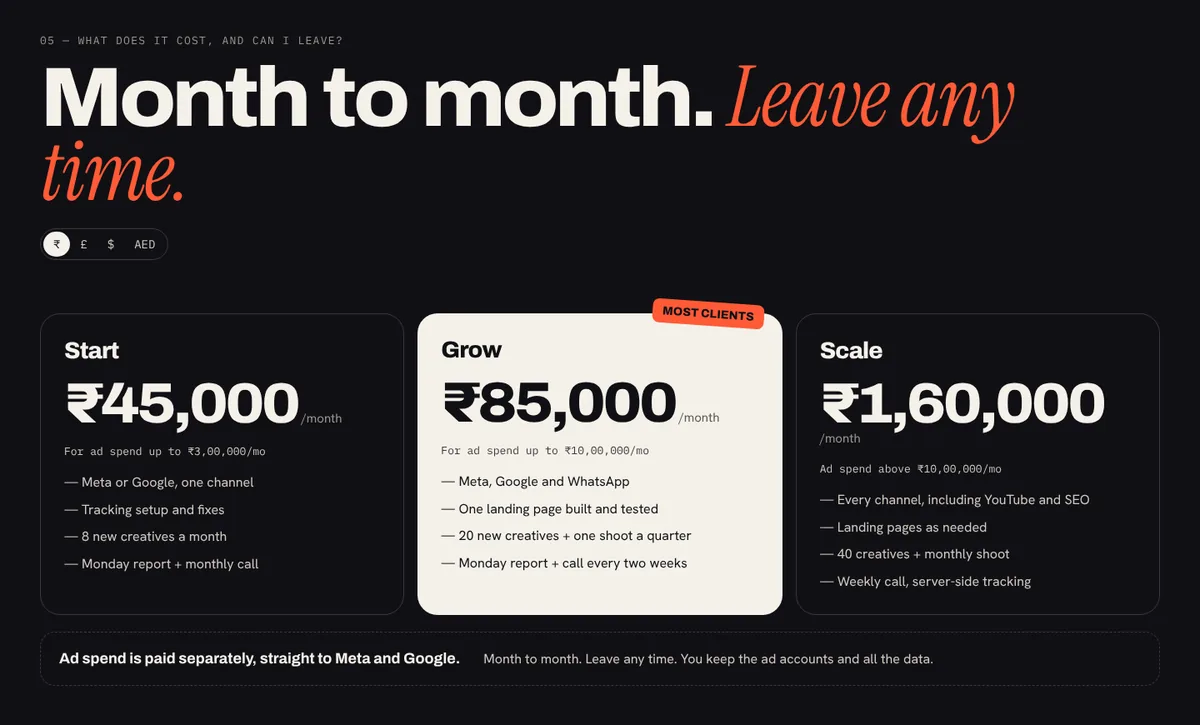
For the agency: prospects who would have waited until next quarter can try it now, and the agency keeps clients because they want to stay, not because they have to.
Step 11
A short call, booked in a few taps
The page ends with “Book a 20-minute audit call.” The promise is specific: they will open your ad accounts with you and point at the three biggest leaks, and if they can’t help, they will say so. A calendar shows free days and times in the visitor’s own time zone, and the form asks for just four things: name, website, monthly ad budget and WhatsApp number. Under the button: “We reply on WhatsApp within two working hours.”
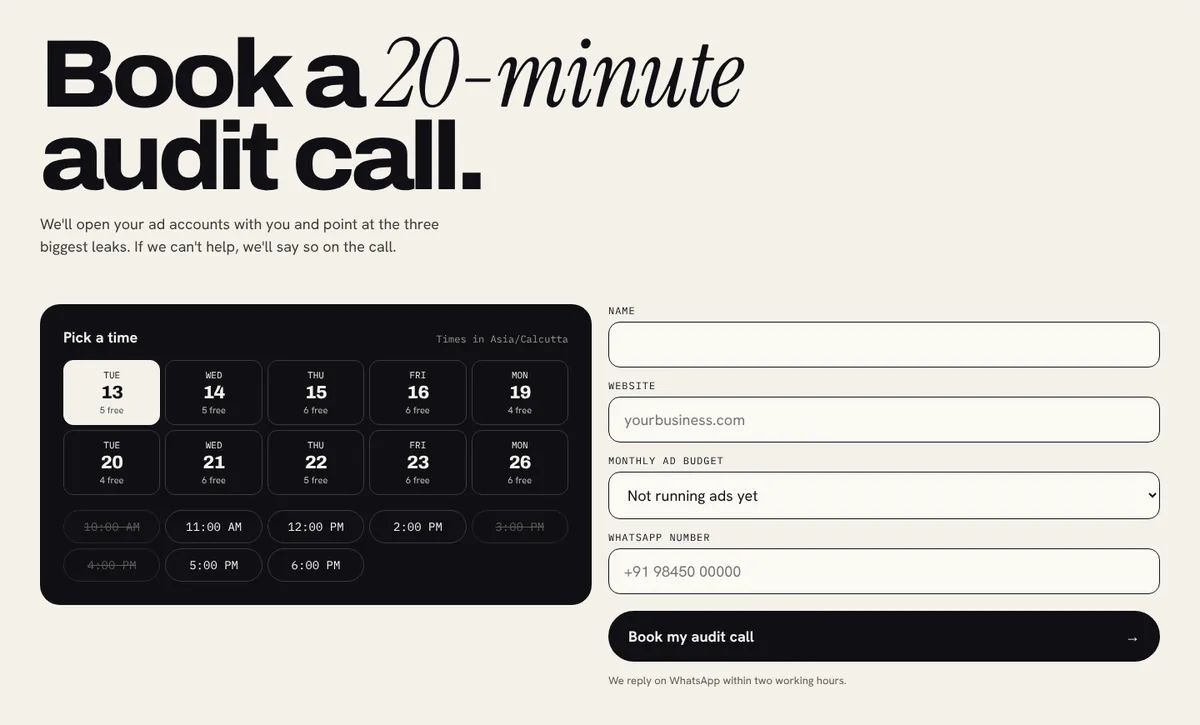
For the agency: more visitors book, and every call starts with their website, their budget and their accounts open.
Step 12
It works on a phone
Most owners first open an agency’s link from WhatsApp or LinkedIn, on a phone. On a small screen the headline still fills the screen, the planner’s dividers can be dragged with a thumb, and the Monday report stacks into two columns. The top bar keeps only the logo and Free audit; the currency switch moves down to the planner and pricing.
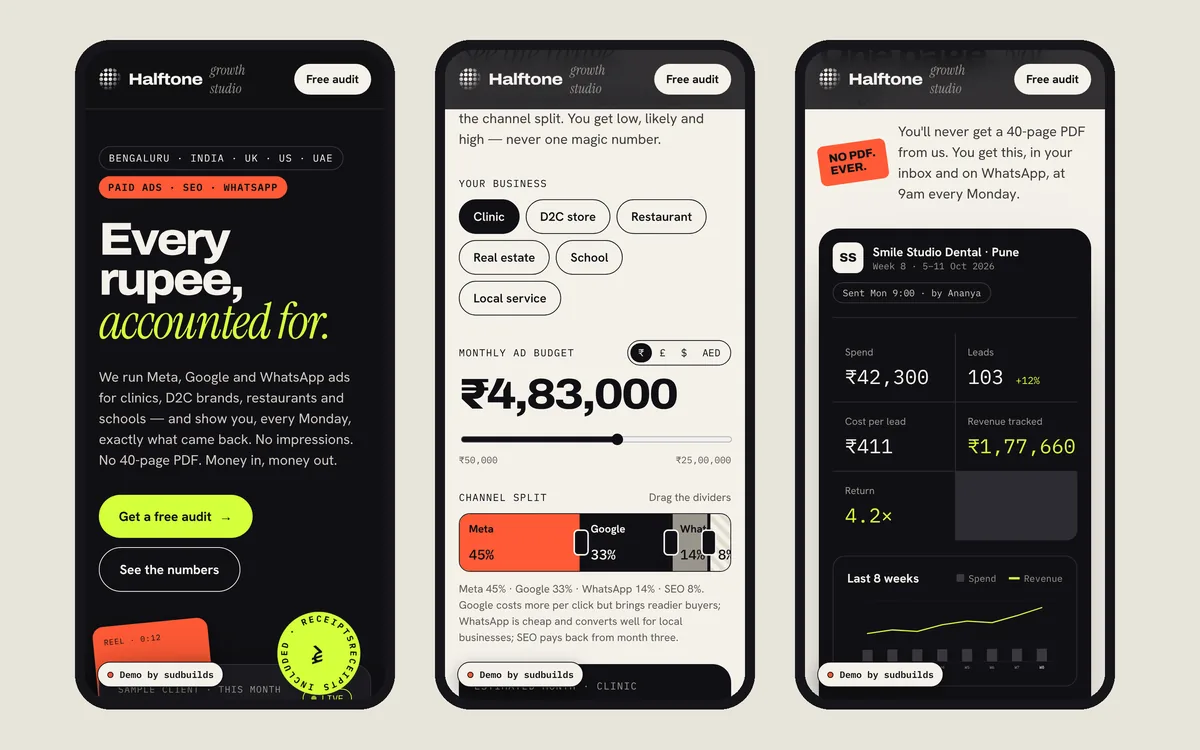
For the agency: the whole pitch, from the promise to a booked call, works from a forwarded link.
At a glance
The psychology at a glance
Every principle used on the site, where it shows up, and what it does for the business owner.
| Principle | Where it’s used | What it does |
|---|---|---|
| Persuasion knowledge | Evidence instead of slogans | Gets past their guard |
| Precise numbers | Money out, money in, return | Results read as facts |
| Honest uncertainty | Low, likely and high in the planner | Realistic and believable |
| Reciprocity | Free audit with fixes | Value before the sale |
| Loss framing | “Is your site leaking money?” | Makes the fix urgent |
| Operational transparency | The Monday report, worst ad included | Trust in the reporting |
| Two-sided message | “What didn’t work” on every case | The wins are believed |
| Social proof | Quotes with how long they’ve stayed | Others like them trust it |
| Labor illusion | Ads that ran and ads we killed | The fee feels earned |
| Goal gradient | The first 90 days | Clients stay past month two |
| Authority and liking | Named team, hours on your account | No bait and switch |
| Status quo bias, eased | Month to month, keep your accounts | Easy to start |
| Fogg Behavior Model | 20 minutes, four fields, your time zone | More calls booked |
Your turn
Steal this for your own agency website
You don’t need a full rebuild to use these. Most can be added to the site you have.
- Put one real client’s spend, revenue and return on your homepage, with their permission.
- Give every estimate as a range, and mark the break-even point.
- Offer a free check of the visitor’s own site or ads, with one fix per problem.
- Show a sample of your weekly report, including the worst ad and what you changed.
- Add “what didn’t work” to every case study.
- Name who works on each account and how many hours a week.
- Publish your prices and your notice period, and say who owns the ad accounts.
- Offer a short call with a clear outcome, in the visitor’s own time zone.
Questions
Questions people ask
How much does an agency website like this cost?
It depends on how much is live. A site with sample numbers and a contact form is very different from one where the planner uses your real campaign data and the audit runs real checks. Send me your agency’s services and how you sell, and I’ll give you a fixed price before any work starts.
Can the audit run real checks on a visitor’s website?
Yes. Page speed, the Meta pixel, the Google tag and the WhatsApp link can be checked automatically with public tools and APIs. Checks that need access to ad accounts stay as a call, which is also the natural next step in the sale.
Isn’t it risky to publish our prices?
It filters out businesses that can’t afford you before they take up a call, and it builds trust with the ones who can. If your prices vary a lot, publish a starting price and what changes it.
Will showing what didn’t work make us look bad?
The opposite, for this audience. Owners who have been burned are looking for an agency that stops wasting money. Showing that you cut what didn’t work is the proof they want.
Will a site like this rank on Google?
The structure helps: pages for each service and industry, real case studies and fast pages are what owners search for. Ranking also depends on your competition and on content and links built over time, so I plan that with you.
Are the clients, numbers and people in the demo real?
No. Halftone is a fictional agency, and the clients, results, team, prices and quotes are placeholders. For a real agency, everything is replaced with your own work, people and numbers before launch.
Further reading
Sources and further reading
The principles above come from published research in psychology and behavioural economics. If you want to read further:
- Friestad, M. & Wright, P. (1994). The persuasion knowledge model: how people cope with persuasion attempts. Journal of Consumer Research.
- Schindler, R. M. & Yalch, R. F. (2006). It seems factual, but is it? Effects of using sharp versus round numbers in advertising claims. Advances in Consumer Research.
- van der Bles, A. M., van der Linden, S., Freeman, A. L. J. & Spiegelhalter, D. J. (2020). The effects of communicating uncertainty on public trust in facts and numbers. Proceedings of the National Academy of Sciences.
- Cialdini, R. B. (1984). Influence: The Psychology of Persuasion.
- Rothman, A. J. & Salovey, P. (1997). Shaping perceptions to motivate healthy behavior: the role of message framing. Psychological Bulletin.
- Buell, R. W. & Norton, M. I. (2011). The labor illusion: how operational transparency increases perceived value. Management Science.
- Eisend, M. (2006). Two-sided advertising: a meta-analysis. International Journal of Research in Marketing.
- Kivetz, R., Urminsky, O. & Zheng, Y. (2006). The goal-gradient hypothesis resurrected. Journal of Marketing Research.
- Samuelson, W. & Zeckhauser, R. (1988). Status quo bias in decision making. Journal of Risk and Uncertainty.
- Fogg, B. J. (2009). A behavior model for persuasive design. Proceedings of Persuasive 2009.